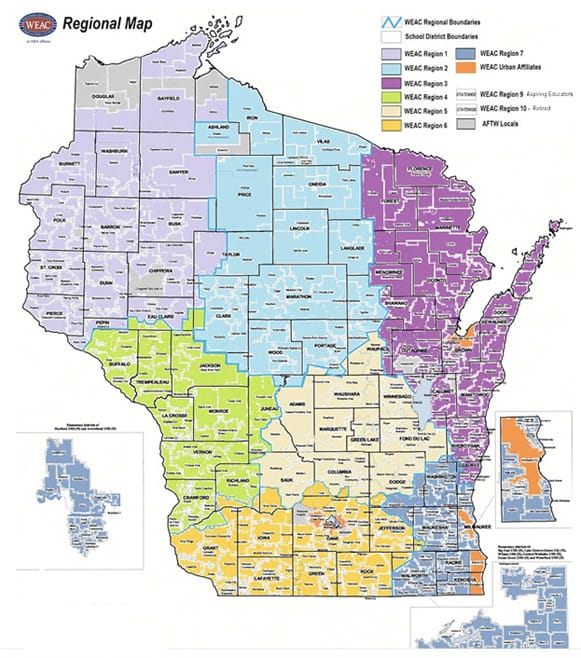
In this Wisconsin school project my group had three counties: Manitowoc, Southern Door, and Kewaunee. We did research on all of the schools within the districts of these counties. We looked for multiple areas of data from numbers of teachers/staff in the district to how much government financial aid each school is given. First off, we found the number of students and teachers who were at each school. We noticed that the more students they had the more teachers they had. It seemed that there were more students in areas that were closer to largely populated cities with many districts. In result, there was a larger number of children at the school who were economically disadvantaged, as well as more students who were english learners. The schools who had a high percentage of english learners tended to have lower test scores. The test scores for the students seemed to have stayed consistent throughout the districts, but within them the high school test scores were much lower. I believe this is because of parental influence. In elementary school we are told to sit at the counter and get our homework done, but in high school we are expected to account for ourselves and be responsible and get our stuff done on time we don’t have our parents helping us or making us do the work.
It was also noticed that the schools that had a higher income tended to spend less per student than the schools who had lower incomes which I found strange because I would expect that schools with a higher income would spend more on their students to give them a better education. Manitowoc district schools were making a significantly higher amount of government funding than schools like Southern Door ($41,546,638.23 compared to $3,500,727). The extreme difference in the size of the districts seemed to have caused this difference in government aid. Manitowoc has to spend a lot more money because they have more students and space. Cost of utilities however was a very difficult piece of our research to locate. Not a lot of districts post strictly their utility cost in their budget, they tend to group it into other costs as well. However, utility cost we found tended to vary from 70,000 to 1,000,000 which to me seems highly unlikely.
After all of the data that we found on each of the schools a lot stood out to me. The differences in numbers were very apparent, but what seemed to be most important was the numbers themselves. The per pupil spending was surprisingly high to me as well as the teacher salaries. I understand that teachers do a lot and they deserve more than they get, but I mean when you add up all the teacher salaries together per school holy cow. I just think that this project really made me understand the value of money and how hard it is to account for the things that you need to and its just A LOT of money! When I was looking through budgets to find some of the data it was shocking how much money goes into certain things and I just cannot believe that much money exists within a school. It makes me very fortunate for the education I have received so far and for all of the things that will be done backstage to make it possible for schools to run when I become a teacher.
